We received lots of great questions on the new features and upgrades in Squish during the Squish 6.6 release webinars. Below, we’ve answered each question received during the Q&A portion.
Scripting Upgrades
Can the Python version be changed after Squish is installed?
Yes. In a command prompt, issue the following:
squishconfig --python=2
To set Python 2. Or,
squishconfig --python=3
To use Python 3.
Our Knowledge Base article includes the above commands and explains how to setup a Squish 6.6 installation to use an external Python interpreter.
Does Squish 6.6 support Python type hints?
Yes. The Python editor in the Squish IDE, from version 6.6 on, is based on PyDev 7.3.0. Among other helpful features, this enables support for type hints in Python 3.
Tagged Execution Improvements
How are tags specified for scenarios in Behavior-Driven Development (BDD) test cases?
Tags for BDD test cases are not specified in the same manner as for script-based test cases. In BDD test cases, the Gherkin file format allows assigning tags to a scenario directly within the feature file.
Tag names and other test configuration settings are stored in the config.xml file, located in your test case folder, i.e.:
suite_mySuite/tst_myTestCase/config.xml
Are test case tags local only, or can they be shared with the code in a Version Control System (VCS)?
Yes they can. Tags are stored in the config.xml file within your test case directory. Add this file to your repository to keep it under version control and share it with other committers.
Do tags work across multiple suites, or are they limited only to a single suite?
Tags are assigned at the test case level. Using identical tags, you can, for example, run test cases from multiple test suites in a single execution step. Our Tip of the Week article, Customizing Which Tests are Executed with the Squish Jenkins Plugin, details this using the Jenkins Continuous Integration server.
Remote Control
Does the remote control feature work only for Qt apps and specific Qt versions?
Remote control in Squish 6.6 is not limited to a specific technology or toolkit version; it was designed to work for virtually any desktop, mobile or embedded target.
What is the performance impact of the remote control feature on the controlled system?
There will be some minor performance impact on your device, with slower systems feeling a greater impact. We’ve developed remote control to minimize performance slowdowns by transmitting data only if there is a change in the device’s display.
If you discover some interference during test execution, we recommend adjusting the frame rate in the Squish Remote Control dialog to improve performance.
Does remote control cause delays in starting the Application Under Test (AUT)?
You should not notice any delays in starting your AUT.
How is communication to hardware on the remote side handled?
The communication to the remote device is embedded into regular data streams between Squish and the AUT process. Our remote control solution talks to the remote operating system and queries the rendering API for the device’s screen contents.
How does Squish know which application it is showing?
Squish shows the content of the device’s display, not a single application. However, Squish does require a running AUT on the remote system.
If there are multiple AUTs running at the same time, then the remote control dialog will show a combo box in which you can select an AUT for display in the viewer.
How do I provide credentials if the remote hardware is login protected?
Remote control requires a running AUT hooked by Squish to operate. It uses the security context of that application to access the remote system, so no further credentials are required.
Qt for WebAssembly Support
Is it required to use Squish for Web for testing Qt for WebAssembly content? Can I use Squish for Qt?
Our webinar demo showed the new support using Squish for Web. The Wasm wrapper can be used with Squish for Qt editions, but there are limitations and some necessary preparatory steps for accessing this content. One limitation being that with Squish for Qt, you cannot access web content created outside of the Qt toolkit.
We encourage you to take a look at our Qt for WebAssembly testing blog which outlines steps for testing apps using Squish for Web or Squish for Qt, within the Qt for WebAssembly context.
.NET Core Support
Where can I find the example applications used in the demo?
The example .NET Core applications shown during the webinar are hosted on GitHub. You can find them, and other examples, here.
Android UI Automation Enhancements
Which version of Android does Squish support?
Squish 6.6 currently supports Android 10.0, Google’s latest major release from September 2019.
When you first start out with Squish, structuring and organizing your tests and executions can be a daunting task. Here, we outline a few pointers to help you avoid unnecessary work and ease you into creating a robust and maintainable testing framework!
How Squish Structures Its Tests
If you’ve completed any of the introductory user tutorials (like this one for Qt), you’re probably already familiar with the following. At the top of your folder hierarchy, there’s a Squish test suite folder which essentially contains:
Named test case folders each containing a test script or Behavior-Driven Development (BDD) test.
A shared scripts folder containing a (scripted) object map for identifying UI elements.
The object property names recorded in the object map can be used across all test cases of a suite, so it is a good idea to group test cases using the same UI into a suite.
Follow the DRY Principle (Don’t Repeat Yourself)
Be it part of a script automating UI interaction or an object name: if parts of your script or an object name are used more than once, it’s a good idea to write them down only once and reference them where they are needed. Here are a few ways you can achieve that:
Use BDD tests (see Qt BDD tutorial). BDD tests contain steps, each representing a specific interaction with your UI, and they can be used many times throughout your BDD scenarios. Naming a step helps you think about the goal of that snippet of test code. Something like, “I log in as a user” makes it clear what it does, and is likely to be used in multiple scenarios.
You can also create shared scripts for your test suites, allowing you to share functionality across all of the test cases in that suite.
If you need to share scripts across multiple suites, use global script directories. From version 6.4 on, this advice also applies to object maps, as Squish treats them as scripts.
If something needs changing later on, you know where to make your edits, and you only need to do it once.
Clean Up Your Object Names
If the guidelines above create organized test suites, refactoring object maps is what keeps them organized:
Avoid the occurrence property. Squish falls back on this only if it can’t find any other property to identify an object uniquely. This becomes problematic if other UI elements are added later on and change the order of occurrences.
Account for volatile properties. Some properties might change during execution (an example being the text on labels.) You can either remove properties, or use wildcards or regular expressions. When removing properties from an object name, make sure that it still uniquely identifies an object. Take a look at the documentation for a good overview on how to improve object identification.
If you are already familiar with how object names work and want more control over how they are created, take a look at the object descriptor files. These give more control over which properties Squish uses to generate object names during recording.
Using Tags
Using BDD and running tests on multiple configurations (differing Operating Systems, AUT versions, etc?) Make use of tags! For example, some of your BDD scenarios may not be applicable to a certain configuration. Tagging these (e.g. @foo) allows you to tell squishrunner to exclude them (using our example: --tags ~foo).
The test cases of a suite are executed in order of creation. (You can change that order via drag & drop in the IDE or by editing the TEST_CASES field of the suite configuration file suite.conf.) Sometimes hidden dependencies between your test cases can start to creep in (i.e. case A performs actions on which case B unknowingly relies later on). Randomizing the execution order of tests makes it easier to spot these dependencies. You can randomize execution order of tests (using the –random squishrunner option).
Keep It Simple!
Only write test code when you are sure it will be used! For most test environments, Squish’s test suite architecture and execution modes will be sufficient. Additionally, if you are looking for a feature, check the documentation and Knowledge Base first. Squish might already provide what you’re looking for, saving you the effort of building it yourself.
Coco can be used to evaluate the coverage of a variety of programs. Here, we showcase the instrumentation of Linux Kernel modules.
Prerequisites
This demonstration uses the Linux Kernel Version 4.19.0-9 on a Debian OS. Packages for building the kernel and for using Coco must be installed on the machine as a precondition.
The Linux Module Build System
The build system contains different steps that are necessary to build a .ko kernel module file, displayed graphically below:
We’ve created the corresponding code for the static memory allocation and the handling of the coverage data in “coverage.h”, downloadable below. The only necessary steps are to add the following lines to your existing module source code:
Since the build system temporarily changes the names of .o files in the build from .tmp_filename.o to filename.o, we need to make Coco change the names of the corresponding .csmes files as well. For this, we wrap the objtool with a small bash script. But first, we need to rename the objtool to orig_objtool for this script to work.
We place the following script in the folder /usr/lib/linux-kbuild-4.19/tools/objtool/ with the name objtool.
#! /bin/bash
## This wrapper basically takes the last command and renames the corresponding .tmp_(NAME).csmes file to the name that Coco expects
LASTCOMMAND=${@: -1}
## Cutting the ".tmp_" out of the csmes file for the target
B=$( echo "$LASTCOMMAND" | sed -rn 's/(.*)\.tmp_(.*)$/\1\2/p' )
B="$B.csmes"
## Renaming the csmes file
mv $LASTCOMMAND.csmes $B &> /dev/null
## Normal processing
D=$(dirname "$0")
$D/orig_objtool $@
This script should have the x flag. You can revert the changes by invoking:
Coco usually makes use of the user-space functions malloc and free to allocate memory for coverage data. Those calls could be replaced with the kmalloc and kfree Kernel variants. But for simplicity we will allocate a static memory buffer. For that purpose, we need to set the environment variable COVERAGESCANNER_ARGS.
To make it easier to set the COVERAGESCANNER_ARGS, we can use a short script, environment_variables:
Since Coco is creating temporary files in the header folder, we need to allow Coco to write to the header folders. To do this, type the following command and change the USER spaceholder to your username:
In this showcase, the output is available via an entry in the proc directory. By running the following command, the current coverage is written to the specific file:
Now the generated my_module.o.csmes file and the my_module.csexe can be loaded and viewed in the CoverageBrowser or computed via the Coco command line tools.
Google Test is a unit test framework for C++ programs. This blog outlines steps required to integrate unit tests written in the Google Test framework with the code coverage analysis tool Squish Coco.
We will see how you can get the code coverage for a full test suite (which is easy) and also how to measure the coverage for each test case separately, which is only a little bit more complicated. No change is needed in the test cases, only a few lines of code must be added at the end of the test file.
What is Google Test?
Google Test belongs to the xUnit family of test frameworks. In such a framework, one writes the tests as test cases, which are arranged in test suites of similar tests.
Google Test is used for unit tests of classes and functions. One writes a test suite for the objects one wants to test, and these and the test suite are compiled and linked to a test program that can be executed and then runs the tests.
An Example
In order to show how Google Test works and how to integrate code coverage, we will now use a simple, but not completely trivial example. The task we will solve is the simplification of file paths. We write a function canonicalpath() that takes a Unix-style file path with parent directory references (“..“) and returns a version of the path with them removed. A path “abc/../de” is simplified to “de“, while “../abc” is returned unchanged. No other simplifications are made, and a slash at the end of a path is automatically removed, all to keep the code short. On the other hand, the function handles absolute and relative paths correctly, which makes the task nontrivial.
The Function canonicalpath()
The function canonicalpath() is defined in the file canonicalpath.cpp:
This file contains a test suite with three test cases and a main() function.
The macro TEST has as its first parameter the name of a test suite, and as its second parameter the name of a test case. The statements in braces after the macro are the test code. All statements in the test cases are comparisons (with EXPECT_STREQ) of the return value of canonicalpath() with an expected result. Since EXPECT_STREQ requires char* arguments but canonicalpath() returns a std::string, its return value is converted to char* with the member function data().
The three test cases contain tests for relative paths, absolute paths, and the boundary case of very short paths. By reading them you will now be able to understand better what canonicalpath() is exactly required to do.
There is also an explicit main() function in the program. In Google Test, not all test programs have it, because there is a library that provides an appropriate main() function. We will however later need to insert code into main() to use the full capabilities of Coco, therefore we provide it here already.
Compiling and Running the Test Program
Google Test is independent of any specific platform or compiler. Therefore, we do not give here compilation instructions for all systems — instead we refer to the Google Test documentation. It contains recipes for several compilers and build systems.
Since, however, concrete examples are always helpful, let us look at the Unix case. There, a minimal Makefile to build and run the tests could look like this:
It just compiles the two source files and links them with the right libraries. “make tests” then runs the test program, and its output contains the list of executed test cases:
[==========] Running 3 tests from 1 test case.
[----------] Global test environment set-up.
[----------] 3 tests from canonicalTests
[ RUN      ] canonicalTests.relativePath
[       OK ] canonicalTests.relativePath (1 ms)
[ RUN      ] canonicalTests.absolutePath
[       OK ] canonicalTests.absolutePath (1 ms)
[ RUN      ] canonicalTests.boundaryCase
[       OK ] canonicalTests.boundaryCase (0 ms)
[----------] 3 tests from canonicalTests (3 ms total)

[----------] Global test environment tear-down
[==========] 3 tests from 1 test case ran. (3 ms total)
[  PASSED  ] 3 tests.
With other build systems and platforms, the build will be different, but the output should be the same.
Integrating Code Coverage
Now we measure the code coverage for the tests and the program.
Coverage for the Whole Program
Once again, since Google Test is agnostic with respect to the platform and build system, we will not give much advice how to instrument the code. The Coco documentation contains instructions to instrument programs that are built under CMake, QMake, Visual Studio, MSBuild, Gnu Make, Microsoft NMake and several other build systems — so it should be possible to compile the tests with Coco enabled.
For Unix Makefiles, the easiest approach appeared already in one of our tutorials: we write a shell script that sets all environment variables that are needed to run a compilation with code coverage. The script is called instrumented, and in our case it looks this:
With it, one can issue “./instrumented make clean tests” to rebuild the tests and run them again, this time with Coco. Two new files are then created: canonicalpath_tests.csexe and canonicalpath_tests.csmes. The first file contains the coverage measurements and the second one the data to interpret them. We will mostly speak of them as the .csexe and the .csmes file.
For other build systems, the details can be vastly different, but they always include the setting of CoverageScanner flags and a full recompilation. The flag --cs-on enables the code coverage (and is not needed in all setups), while --cs-exclude-file-abs-wildcard=*/canonicalpath_tests.cpp excludes the file with the test definitions from code coverage: only the code coverage of canonicalpath.cpp is meaningful.
(And on Windows systems, the names of the coverage files become canonicalpath_tests.exe.csexe and canonicalpath_tests.exe.csmes.)
Measuring Each Test Separately
With the current setup, we can get the code coverage of canonicalpath() for all tests of the test suite together. But we can even get the coverage for each test separately, so that we can see for each piece of code by which tests it was run.
For this we need to combine two features of Coco and Google Test.
Coco provides library functions for every instrumented application. With them, the application can report the name of a test, its result and the accumulated coverage measurements to the .csexe file.
Google Test, on the other hand, has a TestEventListener class, which makes it possible to run specified pieces of before and after each test and also to provide them with the name of the test and its result.
An Event Listener Class
To use these features, we must create a subclass of TestEventListener in canonicalpath_tests.cpp that calls the Coco library functions. We put the class definition at the end of the file, just before the main() function. This is the code of the class definition:
The CodeCoverageListener class is surrounded by an #ifdef … #endif block, so that it is only compiled when code coverage is enabled. (The symbol __COVERAGESCANNER__ is then automatically defined.)
For Coco, we only need implementations of the member functions OnTestStart and OnTestEnd. But since Google Test declares many member functions of TestEventListener as purely virtual, we have to provide implementations for all of them. The implementations of the unused functions appear — compressed as much as possible — in a block at the beginning of the class definition.
The function OnTestStart() first sets all coverage counters to zero, so that any previous activity of the program does not get recorded. Then it writes the name of the test to the .csexe file. In the implementation above, the name has the form “testsuite/testcase“, but you can change it and define your own format. The slash, however, is important, since it is used by Coco to put tests into a hierarchical order.
OnTestStop() writes the test result to the .csexe file — it can be “PASSED”, “FAILED”, or maybe “UNKNOWN”.
The main() Function
The newly created class CodeCoverageListener must then be registered with Google Test. This is done in the main() function, which now looks like this:
Now the code must be recompiled and run again. Then the resulting .csmes and .csexe files can be loaded into Coco’s CoverageBrowser. The result might then look like this:
On the left, in the “Executions” window, you can see the names of the test suite and the test cases. I have chosen here a hierarchical view mode in which the test cases appear one level below the test suite — the slash in the test names that were given to __coveragescanner_testname() makes this possible. At the right of it, there are the test results, which are always “PASSED”.
With the coverage measurements separated by tests cases it is now possible to get the coverage just for one or more test cases. In the image, only the coverage for relativePath is selected.
In the same way as this demonstrative example, other Google Test projects can be instrumented and their code coverage measured.
When opening a new Behavior-Driven Development (BDD) test case in the Squish IDE, a default feature file will display. Since Squish 6.4.1, you can define your own feature file template to open when creating a new test case.
Customizing Your Feature File
Within the scriptmodules/ directory (located in Squish’s application directory), you’ll find a test_template.feature file. To create the custom template, first open the file in a text editor of your choice. It appears as follows:
You can then edit the file to adapt it to the needs of your organization. After saving the changes, every newly created BDD test case will open following your template. Here is a sample, custom BDD feature file template:
Template entries will vary from team to team, but some common entries for custom templates include:
Original author
Creation date
Requirement associated with the test case
Workflow or project the test case belongs to
A mini-template for user stories
Internal and external documentation
Copyright statement and licensing
Additional information (e.g., a boilerplate footer)
BDD Tutorials
Check out some of our BDD tutorials on our YouTube channel for some helpful tips and tricks:
As a software tester, you’ll likely want to run your tests on as many platforms as possible. A single test suite which you can execute on all systems would be easiest to maintain. If you are using screenshot verification points (VPs), this may not work out-of-the-box. With screenshot VPs, which record a specific screen capture, they are likely to fail across multi-platform tests.
In this article, we’ll show you how to handle challenges in multi-platform screenshot verification points.
Example: Designing Robust, Multi-Platform Tests with Screenshot VPs
We’ll use the Address Book example application on Windows and Linux, using Squish for Qt. This application is packaged with all Squish installations. Taking a first look at the application’s main window, it’s clear the differences across platforms:
Linux
Windows
As a result, any screenshot comparison will not succeed out-of-the-box. Our approach will utilize some scripting and a set of screenshot VPs for each platform.
First we create our verification points in the Squish IDE, by putting a breakpoint on the script where we want to create the VP. Once we have created all the VPs, we use a folder structure, as in the below image, to store the VP files:
In this example, the screenshot verification VP_mainwindow simply compares a screenshot of the initial window from the Address Book. This looks as in the below image, on Windows systems:
While we placed the verification points in the test case resources here, you can also store them in the test suite resources or the Global Scripts folders.
For the scripting part, we are using the following code example:
import names
import os

def main():
    startApplication("addressbook")
    snooze(5)
    RunVerification("VP_mainwindow")

def RunVerification(name):
    directory = currentApplicationContext().osName
    test.vp(os.path.join(directory, name), "Verification point on {}".format(directory))
The RunVerification function decides from a Python function which folder the VP file is in that should be used. In our example, this is based on the operating system of the Application Under Test (AUT). An alternative would be a trial-and-error approach which tries all variants of a VP:
def RunVerification(name):
    testSettings.silentVerifications = True
    for root, dirs,_ in os.walk("verificationPoints",topdown=True):
        for directory in dirs:
            if test.vp(os.path.join(directory, name)):
                test.passes("Visual Verification {} passed on {}".format(name,directory))
                testSettings.silentVerifications = False
                return
    test.fail("Visual verification {} failed".format(name))
    testSettings.silentVerifications = False
This approach is more interesting for engineers working with different resolutions or color schemes, and who have no concrete way of determining which set of screenshot VPs should be used.
Looking to run Squish tests in Azure DevOps? This is now possible with a new extension available on Microsoft marketplace. This extension not only enables you to execute Squish tests, but also uploads your test results directly into Test Center. And, with the latest Test Center 1.1, we’ve added support for traceability with Azure DevOps through the plugin.
We’ll first show you how to install and setup the extension before giving an example on how to map tests between Azure DevOps and Test Center.
After successful install for one of your projects, two new tasks will be available for the Build and Release Pipeline.
The first, is the Squish Task, the goal of which is to run Squish GUI tests on agents. This requires that Squish be installed on the agent which will run this Task. Using the path to where Squish can be found, it is then only a matter of choosing which test suites or cases to run and how the test results should be generated.
For users looking to upload results to Test Center, there are additional fields for naming the project and specifying labels for later analysis. Test results will be uploaded in the indicated Test Center instance under the user for whom the Upload Token is assigned.
Azure DevOps & Test Center
Assuming the URL of the Azure DevOps instance is correct (including the organization/collection), only the Personal Access Token (PAT) of an Azure DevOps user is needed to link it to Test Center.
From this point, it is possible to associate a Test Center project to an Azure DevOps project.
For these projects, you can then map test suites or cases to Azure DevOps tests.
This article focuses on improved data analysis features of Squish Test Center 1.1. More specifically, we focus on changes we’ve made to the Dashboard, Timeline and Graphs page, changes which were made to enhance the workflow of any user. We encourage you to take a look at the official 1.1 release announcement for an overview of other enhancements not specifically covered here.
Improvements to Dashboard & Project Overview
Test Center’s Dashboard acts as a central summary of your result uploads, showing at a glance indicators for the health of your projects. We’ve improved the look and functionality of the Dashboard to include more details to the project overview. Where we previously showed only the test status of the most recent test runs, we now show the name of each batch and the labels associated with it. Which labels should be displayed can be configured by the user.
Next to retrieving the most recent reuslts by execution time or upload time, a new option exists for retrieving the most recent results for each label value. You can set this up to show the most recent result for each branch of your Application Under Test (AUT), or the most recent result for each configuration on which you run your tests.
For each project, you can now display the latest result by label on the Dashboard.
If you encounter test failures in your current development branch, you might want to compare the results quickly against the stable branch of your AUT. We’ve now made the comparison functionality accessible directly from the project overview. Previously, it was required to take a detour via the History page.
You can now initiate the batch comparison directly from the Dashboard, using the compare buttons on the right side.
Whether you’re dealing with several test runs in a short timeframe, or with many different branches developed in parallel, you can now also increase the number of recent results shown in the overview.
Since Test Center was built to handle projects of any number, we’ve improved the listing of projects in the Dashboard. Now, you can filter the projects to show only those of current relevance. Previously, projects were sorted either by latest execution or upload time, whereas now, you can filter and sort to give you a desired — and more predictable — order of projects.
Improvements to Timeline Visualization
Until 1.1, the timeline showed only the passed or failed state of a test run at a specific point in time, while the name of the test run was shown only as a tooltip. Now, you can choose to display the batch names directly in the timeline as well, giving you a better idea on which test runs you are currently visualizing.
While it was already possible to look at the timelines of a specific label (e.g., to look at the history of a specific branch), you can now display label values within the timeline, too, which provides additional information about the displayed test runs. An example where this is useful, would be viewing the history of a specific test and also seeing for which branches the tests were executed.
Additional configuration options for the Timeline make it easier to identify results for specific labels.
This will make it easier to identify the test runs that are relevant to you.
Improvements to Graphs Page & Analytics
Test Center 1.1 brings with it a major overhaul to the Graphs page, for improved data analytics.
The number of available statistics shown on a graph has been extended to include the following:
Passes
Failures
Passed tests
Failed tests
Warnings
Skips
Duration of tests
It’s also now possible to combine the above in a custom way. For example, you could show the number of passes next to the duration of tests, to analyze if a change in the duration is caused by new tests being added or tests not being executed.
The improved graphs will help you analyze test duration changes.
When choosing multiple statistics of the same unit, you can also choose to show them either stacked or clustered.
Depending on the data, it might be easier to spot trends in a clustered or stacked graph.
Within the Graphs page, you can view the statistics across all test cases, or you can select an individual test, scenario or step. When looking at the statistics across all test cases, you can choose to look at a single summarized value, or you can look at how much each test or label contributes to the overall value. When looking at the distribution across test items, it’s also possible to drill down into the hierarchy from within the graph itself, using a mouse-click.
Here we can see how much each of the test suites contributes to the overall execution time
Hovering over bars in the graph will show you a tooltip that reveals detailed information about the other statistics currently not displayed in the graph.
Even in a duration graph we can see the number of passes and failures in the graph’s tooltip.
Wrap Up
Test Center 1.1 brings with it a plethora of new features for more advanced analysis of your test result data. No matter your project size, Test Center can help you assess application health with ease.
Our Squish GUI Tester lets you automate applications using a wide range of technologies, such as web pages, desktop applications and many more. However, many complex applications make use of not just one but multiple GUI technologies for building the user interface. In particular, embedding web content into an existing application using Chromium gets more popular every day.
Follow me along and learn how to automate your embedded Chromium web content. To do so you would need to have a license key which covers the toolkit of your main application as well as Web for example Windows+Web.
The Basic Recipe
Figure out which version of Chromium was used. Your developers should be able to answer this as well as sharing the needed Chromedriver executable. Make sure your version matches, otherwise you won’t be able to get access to the web part. In addition the remote debugging port needs to be enabled. In most CEF technologies it is sufficient enough to use the start parameter --remote-debugging-port=xxxx. In some technologies the port is hard coded.
Tell Squish where your Chromedriver is located. This can be done by modifying the ChromeDriverForChromiumBasedApps setting from the webwrapper.ini file located in YourSquishInstallPath\etc.
The Test Script needs to be improved in order to hook up the chromium web part in addition to your regular application (e.g. Windows).
A Living Example
The sample application I’m going to use was build with MFC which means I can use a regular Squish for Windows package to automate the regular application as well as the Chromium Web part.
On the download page of the application it is mentioned that the Chromium Version was updated lately to CEF version 87.1.11 so I downloaded the matching ChromeDriver 87.0.4280.88 version from https://chromedriver.storage.googleapis.com/index.html . I told Squish where to find this new Chromedriver.exe file as you can see in the Screenshot below.
Once a test suite for Windows is set up I can start my first recording. I didn’t interacted with any UI yet so the Python test script code is very brief:
def main():
    startApplication("CEFDemo")
The script needs to be prepared for interacting with two different toolkits. Also, the application needs to be started with an additional parameter which is important in order to get access to the web component. Your developers should be able to help out if the parameter isn’t available yet. After some manual modification the Script look like this:
What this does is to start our ‘CEFDemo’ application such that it exposes the web component via a TCP/IP port (port 12345). The script then launches a new special __squish__webhook application (shipped with Squish) and finally uses the attachToBrowser function to connect to the Chromium component listening on port 12345.
Now you are able to automate both parts of the application, the “main” GUI which is based on MFC as well as the embedded Web part:
def main():
    win_ctx = startApplication("CEFDemo --remote-debugging-port=12345")
    testSettings.setWrappersForApplication("__squish__webhook", "Web")
    chrome_ctx = startApplication("__squish__webhook")
    attachToBrowser(12345)
# search for froglogic in google (opened www.google.com page is a requirement)
typeText(waitForObject(names.google_q_text), "froglogic")
mouseClick(waitForObject(names.google_btnK_submit))
# switch the application context in order to send commands to the MFC application again
setApplicationContext(win_ctx)
# create a new Browser Tab inside the MFC application
mouseClick(waitForObjectItem(names.cefmfcdemo_tests_intro_html_MenuBar, "File"))
mouseClick(waitForObjectItem(names.file_MenuItem, "New"))
Last but not least, there’s a wide range of different ChromeDriver versions available. See the ChromeDriver download page for a full listing of all available versions to find the one you need for your own application.
The Coco team at froglogic is excited to deliver a new release of Coco, version 5.1.0, available today for download. This release offers users significant ease-of-use improvements when compiling, plus a number of bug fixes in all aspects of the program. Read the release highlights below:
New: Visual Studio Coco Wizard for Simplified Build Configuration
Project configuration for Visual Studio-based projects received a major overhaul in 5.1.0. Users of the former Microsoft Visual Studio add-in are familiar with the lengthy process of configuring their build modes: a listicle of tickboxes to activate various coverage parameters characterized the setup. Now, project configuration is simplified to a 2-page graphical wizard which can be used within Microsoft Visual Studio or outside of Microsoft Visual Studio as a standalone app for Visual Studio projects (e.g., .NET Core).
The new wizard guides you through project configuration in a more user-friendly way: you can drag & drop coverage options; add rules through filters; generate a summary of the build mode; and get online help through integrated documentation for each setting. The wizard works multi-platform, including on Linux and macOS systems, includes a command line version to modify the project via scripting, and is general-purpose in that it is not limited strictly to the MS Visual Studio Integrated Development Environment.
New Support for Specifying Trigger Functions & Custom C Library Source Files
The default method by which Coco saves the coverage data is via writing to a file when the program exits. This method is standard for, e.g., desktop applications which terminate normally, but is inconvenient (or not possible) for applications which run continuously, as is the case for embedded systems or servers. Before, users would need to add statements to their code, explicitly saving the coverage data.
Coco 5.1.0 brings a new feature for saving coverage data that does not touch application files: via trigger functions. Users can specify a trigger function which adds the required lines for saving the coverage automatically. That is, the trigger function switch will tell the CoverageScanner where and when to put the coverage saving function at compile time.
Additionally, Coco now supports supplying custom C library source files, compiled as part of the instrumented program. These source files are meant to contain user-defined code (e.g., Custom I/O), are included automatically in the build, and remain separate, that is, do not touch application code.
Automatic Flag Detection for Cross-Compilation
The CoverageScanner now makes intelligent guesses for typical --cs-libgen compiler parameters for instrumentation of OS kernel modules and embedded system cross-compilations. This auto-detection of command line switches was developed in an effort to reduce common compilation errors and make Coco a more ‘plug-n-play’ tool for embedded toolchains.
Augmented C++20 support
The C++20 threeway comparison operator <=> is now supported.
Simplified Qt QML Instrumentation
Previously, instrumentation of Qt QML code required that the user replace one of the Qt shared libraries with a patched version provided by froglogic.
Now, the instrumentation is handled by cocoqmlscanner and a new tracker object which is compiled by the customer. The tracker object holds the counters for the instrumentation, and writes the coverage. The chief advantage to this new method is that there is no need to obtain a new library if the Qt version changes.
Key Fixes
Build issues resolved for Linux Kernel modules.
.NET Core support on Windows added.
Cobertura reports now optionally report manual validations; issues with this report type for Azure DevOps have been corrected.
Join the global Squish community online, from anywhere
Get up to speed on the latest in test automation and Quality Assurance at Squish Days Online 2021. Tech talks, developer roundtables, best practices, feature showcases — all at this year’s virtual event.
Beginner, intermediate, and advanced users are all encouraged to attend.
Embracing Behavior-Driven Development: A Human-Centric Approach
Automating Hybrid Technology Applications
How to Convince Your Boss to Attend
It’s a no-brainer. Learning the state-of-the-art in software Quality Assurance will put you and your team in a better position to:
test continuously & on more platforms
detect bugs sooner
release faster
better meet customer deadlines
We’ve structured our sessions to meet a range of programming and technical proficiencies. Whether you’re just getting started with our tools, or are a seasonsed Squish expert, you’ll leave the conference having learned something new.
Enabled stacktraces for warnings in Squish test results.
Qt Application Testing
Fixed crashes on startApplication when squishserver was built with Qt 6.1 or newer.
Resolved compatibility issues with qtbuiltinhook.pri for Qt 6 on Android. Before, qmake would print an error requiring a minimum Qt version.
Fixed Qt menubar recording and replay on macOS for Qt 6.0 and newer.
Windows Application Testing
Fixed a regression which prevented verification of screenshot VPs on Windows.
macOS & iOS Application Testing
Fixed nativeType on macOS 12 Monterey. nativeType key combinations would often only work on a first attempt; subsequent attempts would trigger the invalid hotkey pressed system sound on macOS.
Web Application Testing
Resolved an issue in Visual Studio Code and other Chromium-based applications which prevented, in particular, script recording and object picking.
We’re excited to deliver Squish 7 as the next release in our development schedule. Here are a couple of the big features in the works:
Video Capturing: The Squish 7 series enables users to capture video recordings of test executions as a debugging aid and as a method of test documentation for quality purposes. This feature syncs the recorded video with the results, meaning you can jump back to a failure point or view the video and corresponding highlighted entries in the test script side-by-side.
Qt 6.2.x support: With Squish 7, testing Qt applications based on Qt 6.2.x will be officially supported.
Give Feedback & Get Support
Let us know how we’re doing, and what you’d like to see in our products, via the comments below.
You can also reach our team, anytime, for questions big or small:
The Test Center team is happy to deliver a major release of Test Center, version 2.0, offering full support for manual testing, in addition to a number of key bug fixes, usability improvements, and performance enhancements in virtually all aspects of the program.
Test Center is a web-based platform for storing, managing and analyzing your software tests as your application evolves. Learn more about the tool [here]().
Manual Testing Workflows in Test Center
While we encourage test automation using the Squish GUI Tester for, among other benefits, improved testing efficiency, we recognize that it’s simply not worth it, or even feasible, to automate every test.
For those cases where automation just doesn’t make practical sense, manual testing is the necessary alternative. To that end, Test Center now offers full support for the creation, execution, and management of manual tests, and their larger workflows.
Here’s what you can do now in Test Center 2.0:
Create manual test cases directly in Test Center: author and format the text with built-in Markdown support, include attachments and inline images, and define Shared Steps, test steps which you can add and reuse in future test cases.
Manage test cycles using the familiar concept of batches which you use to group your automated tests. An Execution Overview pane gives a quick overview of the current test cycle, including each test case’s status and percent progressed.
Assign or re-assign manual test cases to testers based on their availability. Within Test Center, each test engineer can view their current case load from their user account.
Apply the same results analytics features you use to treat your automated test data to your manual test data.
Executed manual tests are treated just like an automated test in Test Center. That means you can use the History View and comparison functionality, too.
Create Jira tickets from within the Test Center UI, linked to your manual tests, and visible to other system users.
Why should I manage my manual workflow in Test Center?
Three reasons:
Reduced administrative overhead. Test Center’s workflow and UI are thoughtfully optimized for fluidity and intuitiveness.
Simplicity. The addition of manual testing workflows means Test Center is your single platform for managing your testing workflows.
Easy migration. If you use an external results management tool like Zephyr or Xray, we have an automated import API for migrating your tests into your Test Center instance. We also support importing Gherkin feature files. For other tools, we encourage you to contact us to see how we can simplify the transition.
Additional Program Enhancements
Improvements to Results Upload
The JUnit result import was improved to retain more result details. Additions include:
The type and message attributes for failure and error elements are now combined to be the event message (using a colon : as the separator).
Multiple consecutive CDATA elements are now supported and combined into a single message separated by new lines.
system-err nodes are now converted to warning events.
Integration Enhancements
The Zephyr for Jira integration now supports both cloud and on-premises versions of the tool.
Jira issue creation was improved in Test Center 2.0. Previously, the ticket’s title and description would auto-generate. Now, you can freely edit all fields similar to how you would normally do it within Jira itself. The issue creation now also supports a wider range of required fields.
For Squish Test Center 2.0 we have decided to primarily focus our efforts on providing support for manual testing. Since Squish Test Center is all about evaluating the health of your application at any given point in time, we felt that seeing the results of your manual tests right next to the results of your automated UI and unit tests is a natural and logical next step. This also means that all test result analysis features for Squish Test Center that you might already use and be familiar with for your automated tests can now also be applied to your manual tests.
The new manual testing area
We added the new manual testing area right next to the existing result views, so you can easily jump from analyzing results to managing or executing manual tests. Just as for our existing result views the test cycles or batches you are looking at always carry over to the next view to allow for fast transitions.
Manual Testing Area
We have divided the manual testing area into three sections. The Test Managementsection is for creating and maintaining manual tests. The Execution Configuration section is for creating and managing a test cycle. The Execution Overview section is for tracking the state of the current test cycles and as an entry point for the manual test execution.
Creating Manual Tests
We tried to reduce the administration overhead as much as possible to allow for rapid test creation. All information that is required to create manual tests are available on the Test Management page, so there are no jarring page transitions or hidden setting fields. Creating or maintaining manual tests with Squish Test Center is a very fluent process.
To avoid a cumbersome and frustrating text editing experience we fully focused on plain text editing with markdown support, just like it is available in most modern text editors.
Of course, we also added support for attachments and in-line images, so that your testers have solid references and all available resources they need to complete the manual tests.
Another important tool we added that will ease the creation of new tests are shared steps. You might already know this feature from Squish test automation, where it is very easy to reuse existing automation steps. We adapted this feature for manual tests as well, so that instead of adding new steps you can always also choose to add existing steps. This will be especially useful for setup steps that are required for multiple different manual tests.
Managing a Test Cycle
We also applied the batch concept that is used all throughout Squish Test Center to manual test cycles. This is also what we use as the link between manual and automated tests. Finished manual tests will automatically be added to the result views based on the batch they have been associated with.
On the Execution Overview page you can get an easy overview of the current test cycle and can quickly see how far along each manual test has progressed. This is also where you can assign or re-assign manual tests based on the availability of testers.
Testers can also use this view to get an overview of all manual tests that are currently assigned to them and to start the manual test execution.
Managing a Test Cycle
If a test cycle needs to be repeated the Execution Overview can also be used to look at previous test cycles, and in a few clicks, the test cycle can be fully or partially re-scheduled.
Manual Test Execution
We also carried over the simplicity of the manual test creation to the execution of manual tests. The same text editing tools that are available during the test creation are also available for the test execution.
You can easily add descriptions and attachments to the observed manual test results. So that if a tester encounters a failure they can easily add screenshots or if there is any output that needs to be archived or documented it can simply be added as an attachment.
All test descriptions also become part of your test results, so that when your manual tests change over time the results will always reference the tests at the time of the test execution.
Issue Tracking & Traceability
With Squish Test Center 2.0 we also generally improved our integration with Jira, specifically the creation of issues, where we added a lot more control over the created issues, by adding support for a wide range of custom Jira fields.
For manual testing that means that when testers encounter any bugs they can easily create issues in Jira right within the manual test execution in Squish Test Center. Bugs created will be linked to the manual tests, and will immediately become visible for all other users of the system. Especially for shared steps that means issues found in previous test executions will be visible to other testers as well.
Manual Test Execution & Traceability
If there are other issue management systems that you would like to see supported please let us know.
Transitioning from other manual testing tools
If you are currently managing your manual tests in Zephyr or Xray then you will be able to transition to Squish Test Centers manual testing in very few configuration steps, thanks to our dedicated API-based import mechanism. There is also an option to import feature files written in the Gherkin language, so if you are documenting your manual tests using gherkin syntax you can make use of this feature to ease the transition. Let us know if you need help migrating from other test management tools.
We are excited to release a new major version of the Squish GUI Tester, the software quality assurance tool chosen by thousands worldwide for cross-platform GUI application test automation.
Squish 7.0 is the first major feature release in almost six years. Its flagship feature – recording video footage of the test execution – is available in all Squish editions for desktops, web, embedded systems, and mobile devices.
Join Us for the Release Webinar
Join our developers for a live webinar and Q&A session on what’s new in Squish 7.0.
With Squish 7.0, we’re moving to subscription-based license models only. This means only customers who purchased or converted to subscription licenses get access to Squish 7.0 and beyond. Customers who own perpetual Squish license continue to get access to Squish 6.7.x as well as technical support for that.
To learn more about how to convert to subscription licenses please contact your account manager at The Qt Company or use the contact form.
Feature Overview
This release also offers more minor features, usability improvements, and many bug fixes for all product editions. Read on for more details on some of the highlights.
Video Capture
The ability to record actions on the screen in a video has been a long-sought-after feature. While 3rd party utilities make screen capture possible, a plain video without any relation to the test is of somewhat limited use and hard to interpret.
Squish 7.0 introduces support for capturing videos of test execution in Squish IDE and on the command line. The captured video is linked with the test results and can be viewed side-by-side. The user can also jump from the point of failure directly to the corresponding place in the video playback.
The video itself is stored as an MPEG-4 attachment to the test results and can be replayed in the integrated video player inside the Squish IDE and Test Center.
Enhanced Support for Qt 6.2
Squish 7.0, Qt edition features full support for testing applications built with the latest Qt minor release, Qt 6.2. Binary Squish for Qt 6.2 packages are available for download, and building from source code against Qt 6.2 is also possible.
In addition, Squish for Qt can now be built without the QtWidgets module to reduce the memory footprint, especially on embedded devices where QML-only applications need to be tested.
Enhanced Platform Support
Packages for testing on macOS are compatible with Apple M1 systems. Windows applications on ARM64 machines and with .NET 6 received initial testing, albeit only in emulated 32-bit Intel mode.
We have also made fixes for testing on iOS with Xcode 13 (and later) and current Android SDKs.
Testing Web Applications: Access to CSS Properties
Creating verifications of CSS properties of HTML objects in web applications was previously possible with Squish to some extent, but it became even more accessible with this 7.0 release. Squish for Web edition now exposes CSS attributes via its properties system and makes them accessible in the scripts as well as in Squish IDE’s property view
Improved JavaScript Engine
With Squish 7.0, users developing their tests in JavaScript can look forward to extended support of operators, better ECMAScript 2015 conformance, new object literal types, and several bug fixes to existing JavaScript support.
Easier installation and administration of Squish License Server
Installation of Squish License Server became much easier with Squish 7.0 as it now comes with a standardized installer that helpfully registers the server as a system-wide service on Linux, macOS, and Windows.
In this release, Squish License Server has also gained a REST API that enables customers to monitor floating license availability and usage across their site. Standard JSON-formatted data containing the server configuration, the list of connected clients, or usage statistics can be retrieved from REST API with the help of scripting languages or command-line tools like curl.
With data like these, system administrators will easily detect bottlenecks or optimize the number of licenses for the site.
Here’s an example command-line call for querying statistics:
curl -s http://localhost:47001/v1/statistics | jq
The output of the JSON conversion may look like this:
The Squish team is happy to announce the release of the Squish GUI Tester version 7.0.1, the software quality assurance tool for cross-platform GUI application test automation.
The first maintenance release in Squish 7.0 series is coming out 3 months after the major feature release version 7.0.0, and is now available for download.
Several stability, performance, and user experience problems are fixed in this version. Here are some of the highlights:
Squish for Qt improvements
Testing AUTs built with the latest Qt6.3 release is now fully supported
Fixed several crashes in RemoteSystem API as well as in nativeType function
Squish for Web improvements
Fixed crash in webhook when testing with MS Edge browser
Improvements in Squish IDE
Fixed missing platform-specific dependencies in Squish Eclipse IDE integration on Windows and macOS
Better performance of replaying BDD tests with large example sets
Improvements in squishrunner
Resolved hang at the end of test execution with video capture and multiple report generators, affecting usage of squishrunner in connection with CI systems (e.g. Jenkins)
Fixed crash in JavaScript interpreter triggered by control flow interactions such as installEventHandler()
For a detailed list of code fixes and enhancements in all Squish editions, as well as in Squish source packages, please see Squish 7.0.1 release notes
For users upgrading from previous Squish versions: Beginning with Squish 7.0.0, Squish IDE is no longer included in binary packages for 32-bit platforms. Squish tools can however still be installed on these platforms and their functionality remains unchanged.
Check the up-to-date list of minimum system requirements to see whether Squish can be installed on your platform.
The Test Center team is happy to deliver the next major release of Test Center, version 3.0, offering support for Squish Coco coverage reports. You can now browse and analyze your code coverage reports next to your test reports stored in Test Center.
Coco Code Coverage Integration
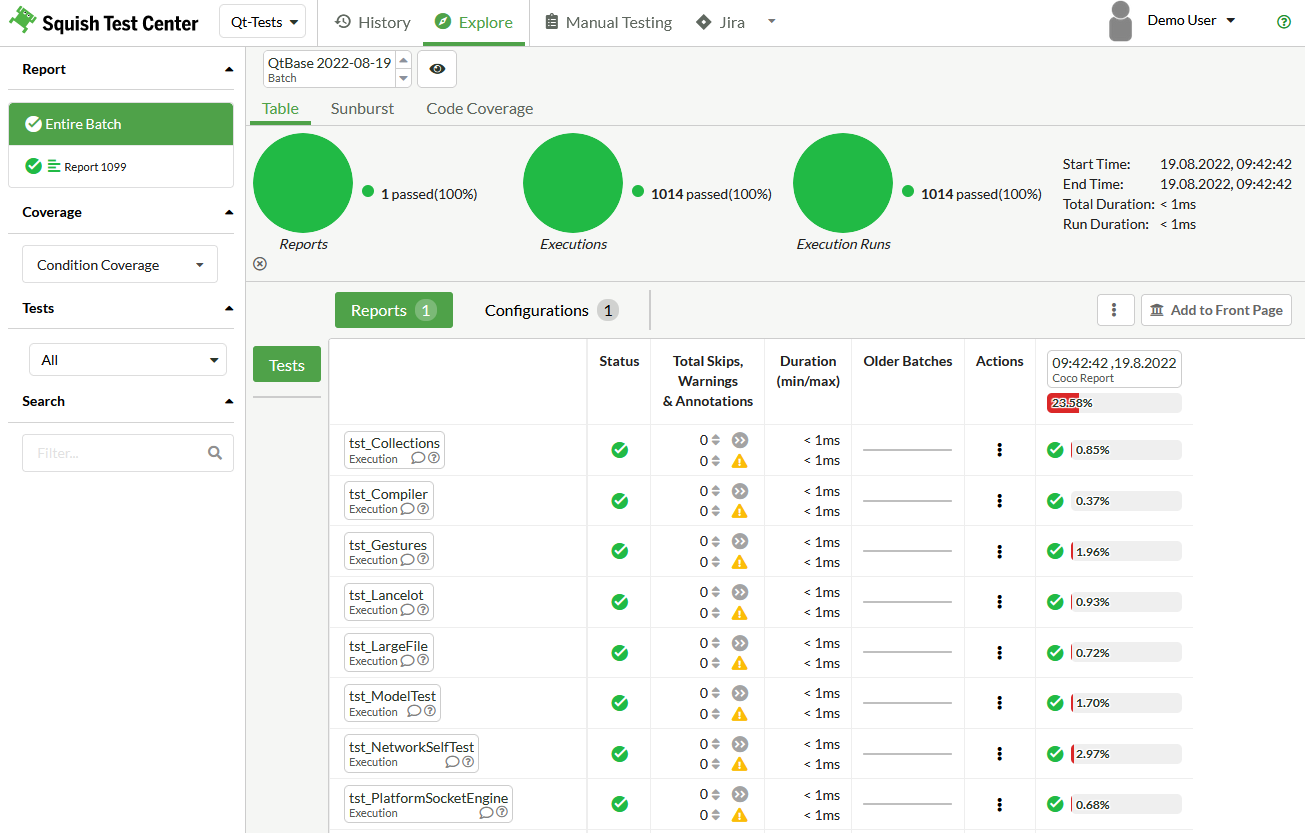
In the past, you had to use the Coco Coverage Browser or generate a Coco HTML report to get a good overview of your Coco coverage results. With Test Center 3.0, most information provided by the Coverage Browser and HTML report can now also be accessed via your Test Center instance, simply by uploading the csmes and csexe coverage result files generated by Coco. The imported coverage reports will become accessible from within the existing result views in Test Center.
Coverage displayed within the explore view
In this first iteration, we added support for the following features:
Support for all coverage methods supported by Coco
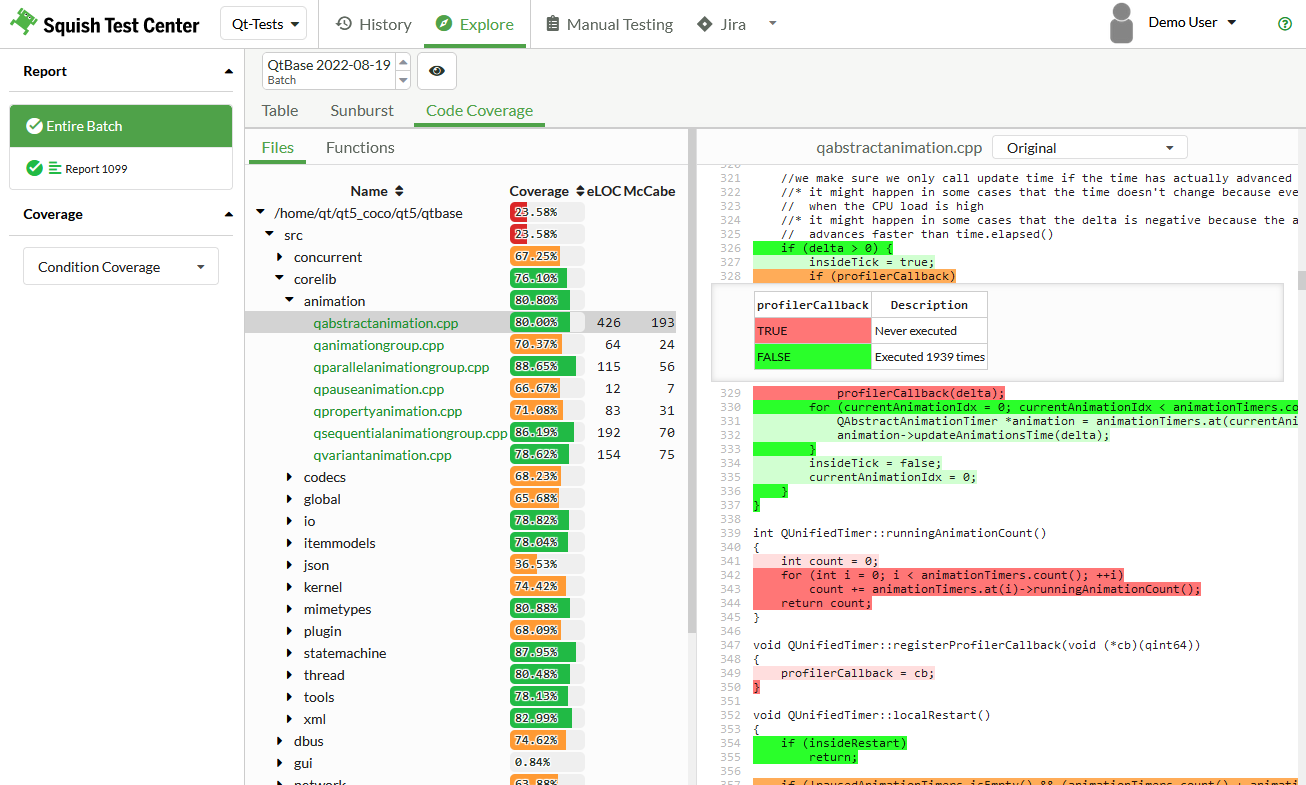
Providing eLOC and McCabe statistics for files, folders, and functions
Displaying coverage results for test executions
Showing coverage results for files, folders, and functions in a new Code Coverage tab added to theExplore View
A source code view that highlights the coverage status of individual source code lines
Truth tables that show the covered condition states
Source code coverage and truth tables for conditions are displayed in the new Code Coverage tab within the Explore View
Like in the Coverage Browser, you can easily switch between the different coverage methods at any time or even view different coverage metrics side by side in the graph view.
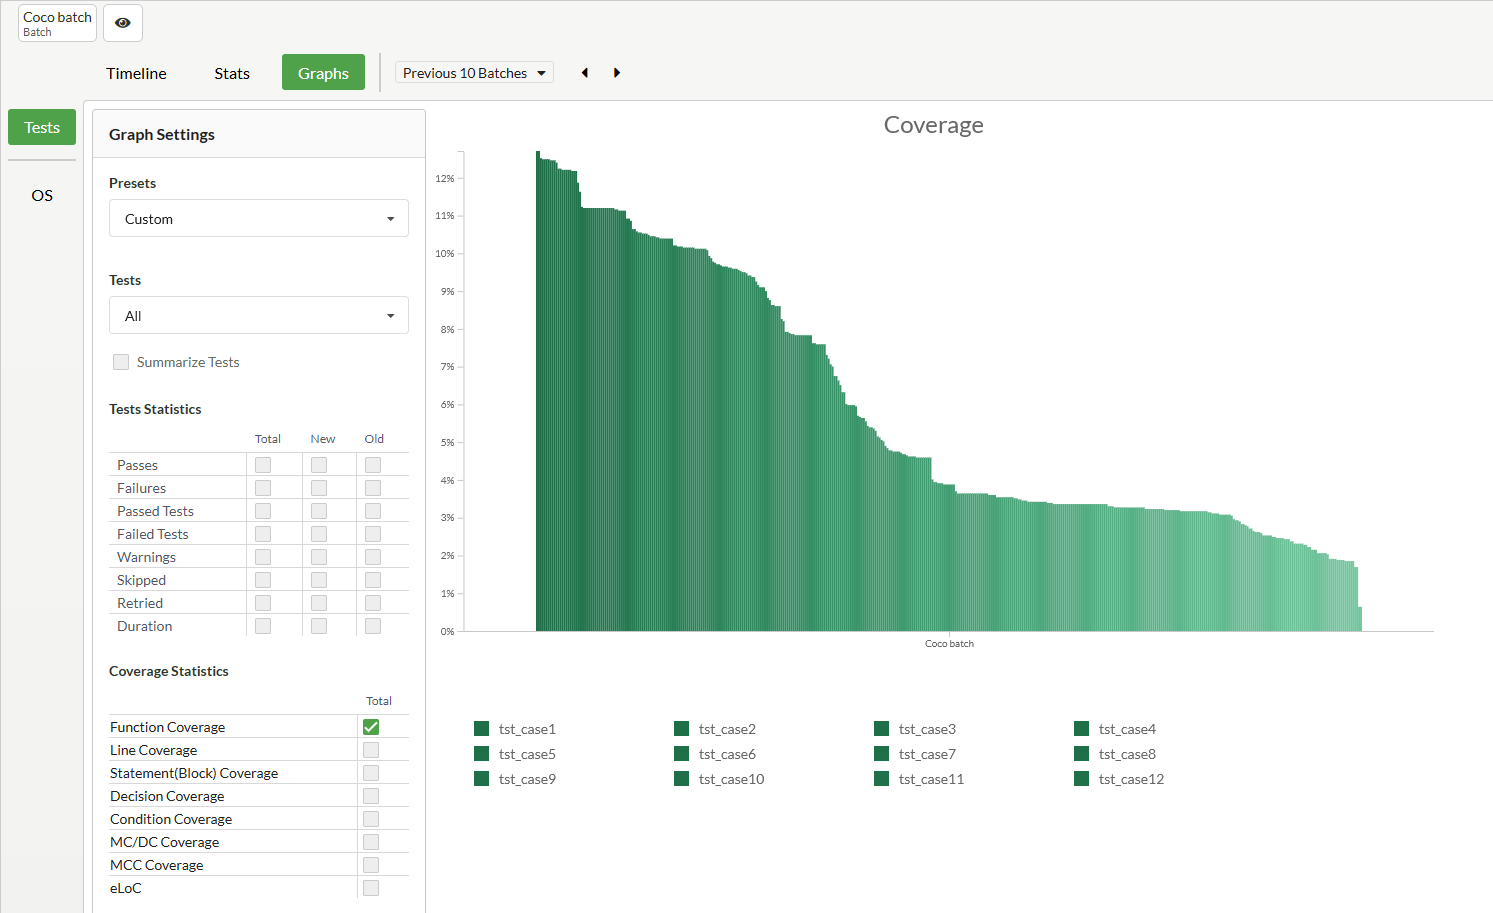
On top of that, you can now easily track your coverage statistics over time, as you can access all previously uploaded coverage reports just as easily as the most recent reports. We have integrated the coverage values in our timeline, where you can see how your total coverage developed over multiple test runs, and you can also look at the coverage of individual test cases or scenarios over time. The coverage values can also be analyzed in the graph view, where you can see how your coverage improved over time. It allows to combine all available coverage statistics and also allows to look at how the effective lines of code have changed in comparison. When limited to a single test run, you can also use it to compare how tests fare against each other.
Coverage statistics in the graph view
As Test Center now offers central storage for your coverage results, you no longer need to worry about distributing the coverage reports among colleagues.
We are happy to announce the release of Coco 6.0. This major feature release brings code coverage information to where developers work: right into their favorite IDE. Be it Visual Studio, Qt Creator, Visual Studio Code or others. Coco can be run as a service in the background and deliver data about covered and non-covered lines to the code editor. This new blog-post provides details on this new main feature.
See the release notes for a full list of improvements. Here is a summary of what makes up this release:
Show coverage information in Visual Studio, Visual Studio Code, Qt Creator and other editors that support the Language Server Protocol (LSP)
Various improvements for C++ and C# language features
Support version 9 of IAR Embedded Workbench
Support clang-based cross-compilation from Microsoft Windows to Linux.
Support the clang-cl compiler
Execution data locking on NFS file shares
Add-In support for Visual Studio 2022
The new release can be found in your download area as of now. Just note that a subscription license is needed for the upgrade. Please contact your account manager to upgrade your license if you have not upgraded already.